Oakland paid $450M in 2023 for pension costs and above-inflation wage increases
The city paid more than $130M in interest alone on its pension debt—far more than its $100M annual deficit, which it just sold the Coliseum to pay. It has unutilized options to mitigate these costs.
Note: you may also like the our podcast discussing the findings of this article.
The City of Oakland’s fiscal health, quality of life, and public safety have significantly deteriorated in recent years. Yet the city spends more per capita than similarly sized California cities and nearly all Bay Area cities. This leaves residents puzzled and frustrated: why does their tax bill keep rising (up 65% since 2013) as city services and infrastructure slide into shambles?
Using primary city and state financial data, we identify the root cause of the city’s struggles: spiraling pension costs and above-inflation wage increases. Further, we break down these costs to understand why they have grown so much and what is the future outlook for the city.
The City of Oakland currently pays $450M annually in pension costs and wage increases beyond inflation. Of that amount, $280M is paying Unfunded Actuarial Liabilities (UALs) – the debt on former employee pension benefits.
The $450M of pension and above-inflation wage spending consumes 28% of the city’s unrestricted revenues. These costs dwarf the approximately $100M structural deficit the city presently faces.
Oakland’s wage and pension costs are larger than, and have grown faster than, nine comparably sized California cities, both in absolute amount and per capita.
The costs partially explain why residents' tax burden keeps increasing, while the city services and quality of life deteriorates.
There are good options to fix these problems and set the city on firm financial footing while dramatically improving city services. But to do so, Oakland’s leaders will need to put residents interests first, above those of narrow interest groups.
Since June, the Mayor and City Council have heralded the Coliseum sale as a means to plug the current fiscal year deficit (FY24-25), and as the antidote to economic and public safety decay in Oakland. But this deal does nothing to address the city’s ongoing budget deficit of about $100M, a fact noted by the city budget director, Bradley Johnson, in June.
And even with these one-time funds, the city has resorted to extreme measures to balance this year’s budget. It cut or froze 100 police and 72 fire staff, exploited restricted funds for general spending, consumed remaining fund balances, and cancelled previously approved program commitments. The bulk of cost-cutting landed on the public safety departments—a trend for the past several years.
But the cuts create a frustrating puzzle for residents of Oakland: why are their taxes rapidly increasing, while city services continually decline and the city’s budget deficit goes unresolved for years on end? Why is the city in a continuous fiscal crisis, causing it to squander irreplaceable assets (while violating its fiscal policy that dictates one-time funds should not be used to pay operating expenses)?
The City of Oakland’s auditor noted in 2023 that the city spends more per capita than other comparable California cities. And to pay for it, the city has raised sales, business and property taxes since 2013. Property taxes have risen 65%, including voter approvals for multiple supplemental taxes that provide more than a billion dollars for road repair and subsidized construction of affordable housing (Measures KK and U).
But there are major contributors to the city’s financial problems beyond infrastructure and housing burdens—in particular, there has been a 62% increase in social service and administrative spending since 2020 (3 times the rate of inflation), and compensation costs have ballooned by more than $400 million since 2013.
The compensation issue is the single most significant driver of city budget issues. And it is generally hidden from view because any Oakland politician who merely discusses the issue risks losing support of politically powerful labor groups.
Moreover, the city administration is not transparent about the components and drivers of compensation costs. City financial accounting hides the full costs in dark corners of the budget, leaving the public with little ability to inspect the issue. For example, debt payments for the unfunded pensions of former employees are hidden as compensation costs for current employees.
As a case in point, we reached out to the city finance department for insight into the issues presented in this article. Although Erin Roseman, the city’s finance director, granted us an interview, that appointment was quickly canceled by Sean Maher, Mayor Sheng Thao’s communications director. Despite multiple further queries to Mr. Maher for a response to our questions, no response was provided.
Moreover, wages are set in closed-door negotiations between city leaders and the union leaders who helped elect them. Clearly this is a conflict of interest that undermines city leaders' commitment to the interests of residents they are elected to serve.
For this analysis, we mined and analyzed primary city and state documents and data sources to shed light on the dark corners of city compensation, and to pick-apart the root causes of the compensation increases. We found that two factors are driving the escalating costs: city worker wages grew 1.9 times faster than inflation, and CalPERS1 (California Public Employees Retirement System) costs grew 7.2 times faster than inflation. In addition, the city continues to pay large costs for the unfunded OPEB (Other Post-Employment Benefits) program, and for the incompletely funded PFRS (Police and Fire Retirement System) which was closed in 1976. Combined, these pension costs and wage excesses sum to $450M in annual expenses ($101M in above-inflation wage increases, and $349M in pension costs).
To put that in perspective, the city’s above-inflation wage and pension spending costs more in one year than the entire amount allocated to road improvements over five years in the 2022 Measure U bond.
These excessive costs are the direct consequence of irresponsible political choices made over the past 40 years. They include underfunding pension liabilities by 20-30%, and awarding “gold-plated” pension benefits without setting aside the funds to pay for them, as an anonymous former senior city leader explained to us. For example, retirement plans were very generous prior to the Public Employee Pension Reform Act of 2013, with safety employees granted full retirement benefits at the age of 50, and miscellaneous employees at age 55. Many of these retirees are receiving pay equal to their maximum salary for the rest of their life. Moreover, a pension holiday was granted in the 1990s and early 2000s wherein CalPERS permitted cities not to contribute at all to pension plans, adding more pain to the underfunding problem.
The “bill” for these decisions has now come due, and it explains why residents keep paying more in taxes while city services deteriorate around them.
If the City of Oakland hopes to find lasting solutions to its ongoing fiscal crisis, it needs to transparently reckon with the choices it is making on labor compensation and social services, as well as its fiscal strategy for managing unfunded liabilities. It could start with open meetings and full transparency when negotiating new labor contracts in 2025. And it could go much further, by reconsidering the efficiency and effectiveness of the city’s social service and administrative layers that have grown 62% since 2013.
Most significantly of all, the City needs to take a hard look at how it is managing the financing of its Unfunded Actuarial Liabilities (UALs). This is the debt the city owes for past underfunding of CalPERS and OPEB pension benefits. The CalPERS debt is costing us $133M in annual interest expenses alone, and is expected to cost $1.5B in interest over the next 20 years until it is paid off. Meanwhile, the OPEB debt continues to grow because the city is not funding the liability sufficiently. The CalPERS debt could likely be refinanced, and the OPEB benefits could be renegotiated per the requirements of a Council Resolution 87551, passed unanimously in 2019. Together, such actions could save the city about $100M a year, while also ensuring that the OPEB debt stops growing.
The city has options to tame these issues and give itself a new path toward public safety, economic growth, and improved livability—if city leaders are willing to choose them. The remainder of this article takes a deep look at these issues, their causes, and the options available to the city to climb out of its present struggles.
Oakland’s annual compensation spending rose $231M more than required for cost of living adjustments since 2013, driven by pay raises and unfunded liability payment costs
Each year, all California public agencies, including cities, must file a report on employee pay and benefits with the state Controller. That data covers 5000 public agencies and 2 million employees.2 It shows that Oakland’s total employee compensation spending grew 92% from 2013 to 2023, from $440M to $844M.
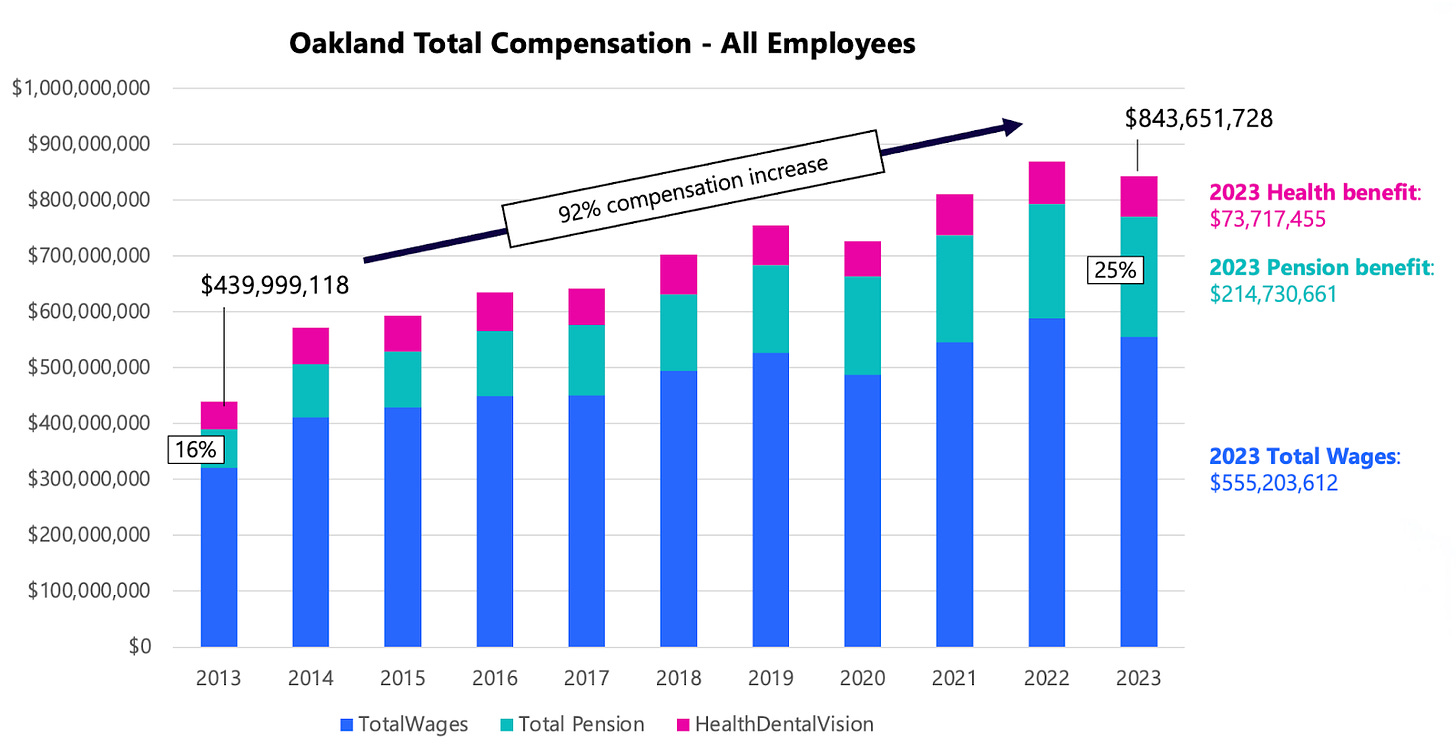
All three major spending components, wages, pensions, and health insurance, grew faster than inflation, which was 38.3% in the SF Bay area during that period of time. But pension spending grew exceptionally fast: a 210% increase from $69M per year to $214M per year.
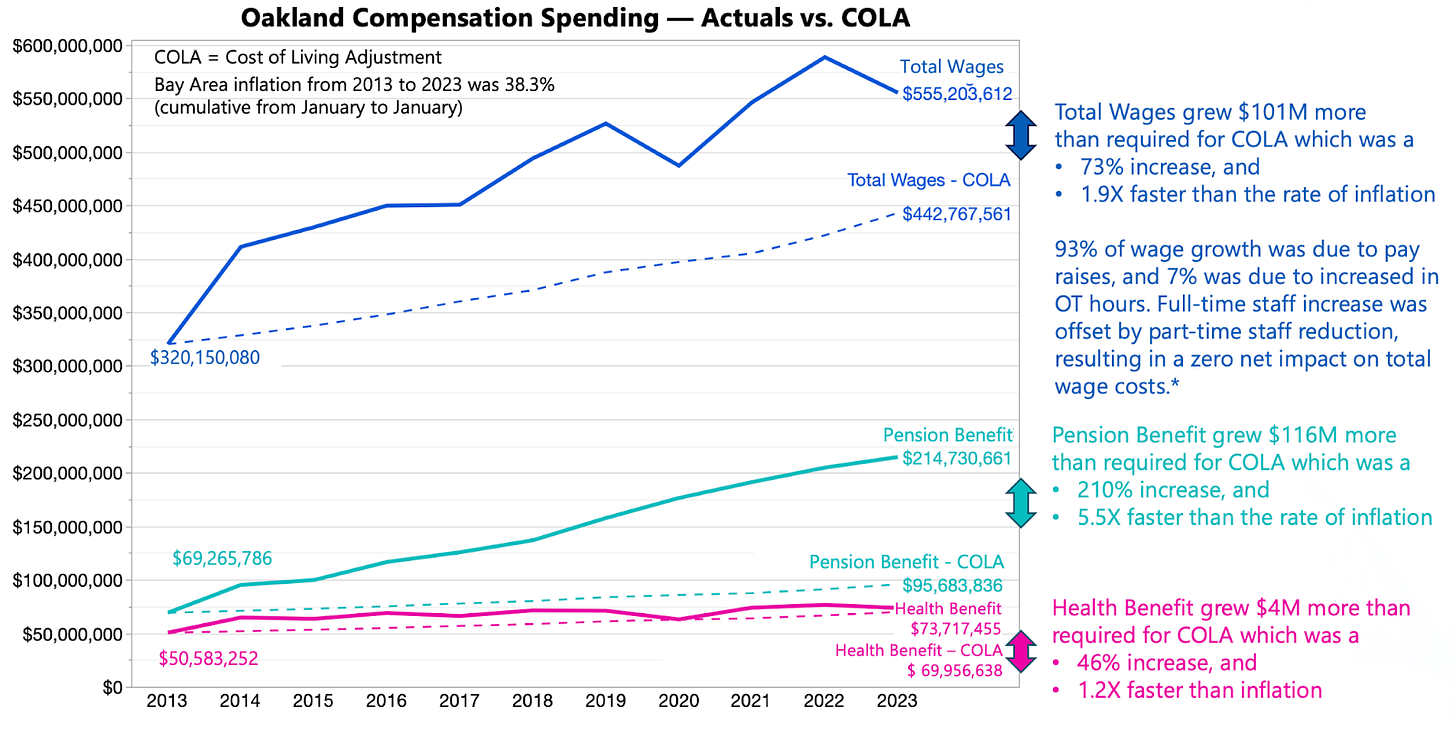
Combined, compensation costs grew $231M more than that required for Cost of Living Adjustments (COLA). Growth in wages (base pay, other pay, lump sum pay, and overtime pay) contributed $101M of that excess spending beyond COLA, while pension benefit growth contributed $116M beyond COLA, and healthcare spending growth only contributed $4M above COLA.
The wage increase was not driven by increased employee count; it was driven mostly by pay raises and by increased overtime to a small extent:
93% of the wage increase was due to pay raises;
7% of the increase was due to increased overtime hours (50% more overtime hours in 2023 vs. 2013);
staffing changes were financially neutral: 104 full time employees were added, but those costs were paid with a reduction of part time staff by 389 positions.3
The escalation in pensions is driven by two components: normal costs and Unfunded Actuarial Liability (UAL) costs paid to the city’s CalPERS-managed pension plans.
Normal costs grew from $30M to $60M;
UAL costs grew from $44M to $164M, accounting for 73% of the city’s CalPERS pension spending in 2023.
The normal costs are savings payments to ensure that the projected pension costs of current employees are fully paid with accrued assets.
UAL costs are debt payments on projected pension costs for former city employees, for whom the city did not save enough while they were still employed. UALs are called “actuarial” liabilities because the amount of such debt is not a literal cash value, rather it is a forecast of the total cost of future pension obligations. These forecasts are calculated by independent actuaries using rigorous economic assumptions. Although the UAL is a computed quantity, not a literal cash loan, it is functionally equivalent to debt—including the requirement for the city to make amortization payments, with interest, to pay off the debt in the next 20-25 years.
Normal costs and UAL costs are paid to CalPERS for the two pension plans it maintains on behalf of Oakland: one for public safety employees (sworn police and fire staff) and one for miscellaneous employees (all other staff). CalPERS calculates and invoices the city for these amounts, and places the payments into the California Employers' Pension Prefunding Trust (CEPPT) Fund (basically a big savings account for future pension costs). Retired employees are then paid by CalPERS out of that trust fund.
While both normal costs and UAL costs are rapidly increasing for Oakland, the causes are different.
As described in detail below, normal costs are increasing because wages are increasing, not because pension benefits are expanding. In fact, the Public Employees Pension Reform Act of 2013 (PEPRA) modified the pension benefits formula for the city, which helped reign-in the city’s unsustainable pension benefit commitments. Nonetheless these reformed pension formulas still pay out in proportion to an employee's highest 3 years of wages. Thus, rapid wage escalation also results in proportionally rapid escalation in future pension costs.
On the other hand, UALs are increasing because PEPRA forced cities to pay off the UAL debt. Oakland currently owes $1.9B of UAL debt to CalPERS. After PEPRA, CalPERS began ramping up these debt payments such that cities are forced to pay off the debt over about 25 years. The debt payments will peak in a few more years at more than $200M, after which time will ease back to about $150M until they are paid off (according to the most recent valuation reports for miscellaneous and safety employee plans).
CalPERS liabilities are not the whole story of pension debt
In addition to CalPERS, Oakland maintains two other pension plans: Other Public Employee Benefits (OPEB) which is still active, and the Police and Fire Retirement System (PFRS) which was closed in 1976 and replaced with a CalPERS-managed plan. Theses plans cost the city over $130M annually. But unlike CalPERS costs, they are not reported in the employee compensation data.4
Together, the three plans CalPERS, OPEB and PFRS cost the city $349M in 2023. Of that, $280M was used to pay down UALs, while $69M was used to pre-fund (save for) the costs of current employees future benefits.
The OPEB plan pays for the costs of retiree health insurance. Until 2020, the city was operating the plan entirely as “pay-as-you-go” meaning that the city directly paid retiree costs out of its operating budget each year, with no savings plan in place to pay for future benefits. This has left the city with a $500M UAL for OPEB.
In 2021, based on passage of Resolution 87551, the City began contributing 2.5% of payroll toward an OPEB trust fund. The goal is to fully fund the plan in 30 years via the 2.5% contribution, or reduce the benefits until the 2.5% contribution is sufficient to fully fund the plan.
In 2023, these costs were $41M. However, they are insufficient to amortize the current OPEB UAL. According to Resolution 87551, if the 2.5% payments are insufficient to pay down the UAL, plan benefits must be reduced until the payments are sufficient to cover the debt. But the city has not fulfilled the obligations of the resolution. As a result, the UAL continues to increase with escalating annual costs for the city.
The PFRS plan pays for the costs of approximately 650 former public safety employees of Oakland, or their spouses if they live longer than the employee. The city has issued a series of tax-funded bonds and direct contributions over the past 3 decades with the goal of paying all debts, and fully funding the plan by 2026 as required by a city charter amendment passed in 1976 and amended in 1988. Accounting for these bonds, the city presently owes about $208M: $97M in UALs on the plan, plus about $111M in final payments on the pension bonds.
The cost of these combined UAL and bond payments are $94M annually, all of which are funded by a pension override property tax of 0.153% first approved in 1981. In 2026, the pension costs and the tax will expire, leaving the city with a potential surplus of $347M in the Pension Tax Override fund balance, and likely no further payment obligations (see slide 29 in supplement). In theory, this will reduce the pension costs to the city by about $90M annually, and the tax burden on residents by the same amount.
How do Oakland’s wage and pension costs compare to other cities?
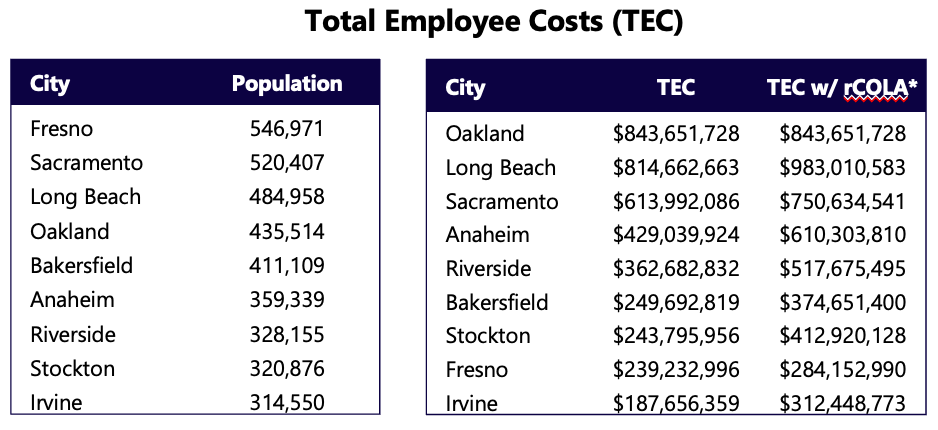
We compared 9 similar sized California cities with populations ranging from 300,000 to 550,000 residents. Oakland sits in the middle of the pack in terms of population size with about 436,000 residents in 2023. But it had a substantially higher total employee cost in 2023 than any other city. After adjusting employee costs for the relative cost of living among the compared cities, Oakland’s compensation costs remain higher than all cities except Long Beach.
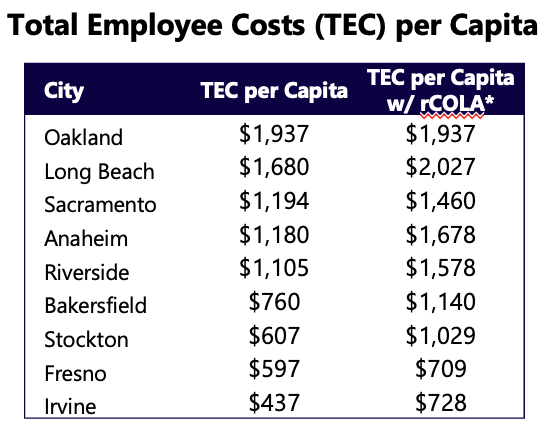
Oakland also has far higher employee costs per capita than any other city, and higher city expenses than any other city (source: 2023 audit). Again, after adjusting for relative cost of living, Oakland’s per capita costs remain higher than all other cities except Long Beach.
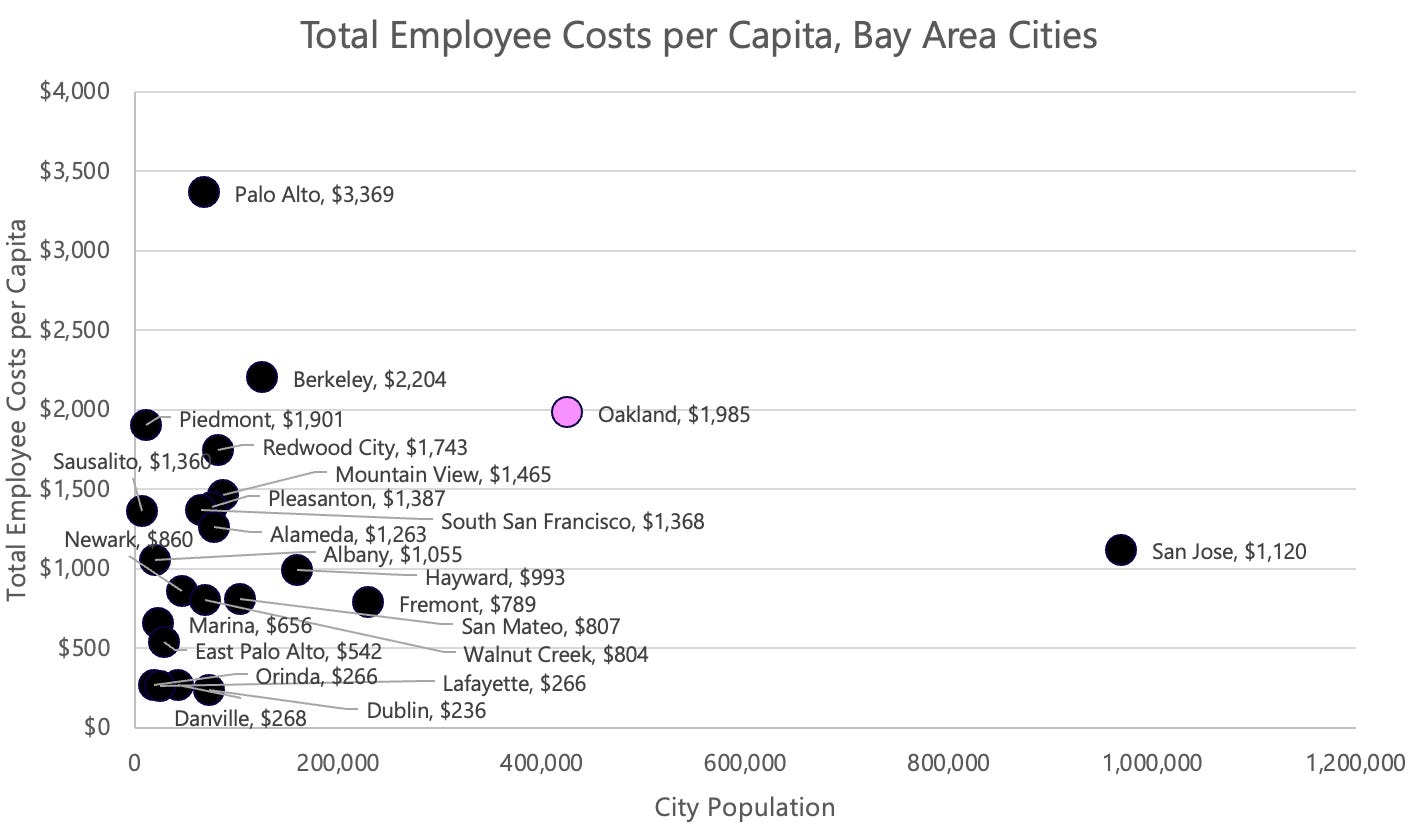
We also examined how Oakland compares to 22 other Bay Area cities, regardless of size. Oakland greatly exceeded its neighboring cities (often more than doubling spending); only Palo Alto and Berkeley exceeded Oakland for per capita employee spending. Note that Oakland spending ($1985 per capita) and Piedmont spending ($1901 per capita) were similar, yet Piedmont’s per resident income is 2.5 times higher than Oakland’s ($140,000 per resident vs. $57,000 per resident).
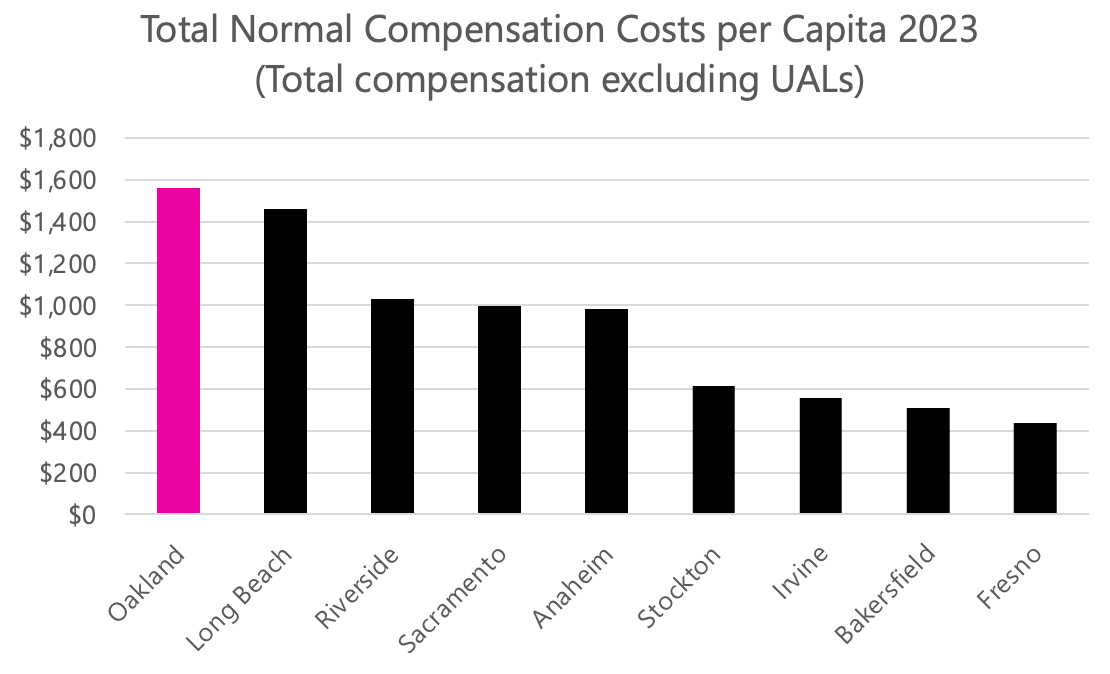
The above figures include amounts paid for CalPERS UAL costs, which technically are not costs borne for current employee compensation. Thus it is also useful to examine the city’s compensation burden for current employees, by excluding UAL payments, which we denote “Total Normal Compensation.” Total Normal Compensation includes base pay, other pay, lump sum pay, overtime, normal pension costs, and health and other benefits. The city’s Total Normal Compensation is higher than any other city. After adjusting for relative cost of living, the Total Normal Compensation remains higher than other cities except for Long Beach (see Plots tab in supplementary data).
As for the city’s annual pension costs alone, Oakland also pays more in absolute terms and per capita than other cities, both in the normal costs and the UAL costs. Notably, Oakland’s UAL payment is far higher than all other cities, even after adjusting for relative cost of living (see Plots tab in supplementary data).

How much have Oakland’s costs grown since 2013?
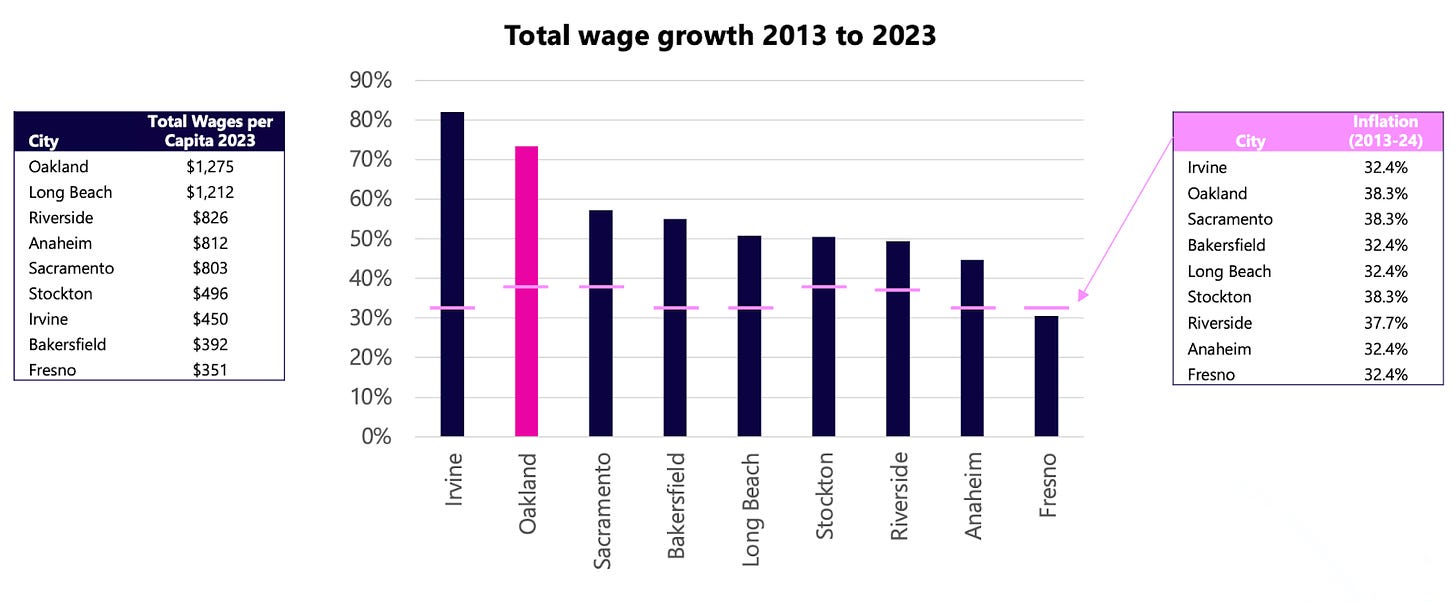
Oaklands wages (excluding benefits) grew 73%, which is 1.9 times faster inflation, and faster than comparable cities except for Irvine. However, Irvine also spends 3 times less per capita on city expenses than Oakland. Thus the impact of this wage growth is 3 times smaller in dollar costs to Irvine residents than to Oakland.
This rapid growth in wages was driven almost entirely by pay raises (93%), with the remainder due to overtime pay increases (7%).
Rapid base wage growth also has a proportional effect on normal costs of pensions. Normal costs (the city’s savings contributions to pay future pensions of active employees), are a multiplier on base wages (typically ranging from 10 to 20%). Thus, as those wages increase, pension costs also rise proportionally.
Oakland’s pension cost growth rate has been similar to most comparable cities. However, Oakland’s higher base wages per capita mean larger normal costs for pensions and a larger burden on residents. Plus Oakland started with a much bigger UAL, leaving it with a greater burden as a percentage of its compensation budget (25%).

How did Oakland’s UALs get so large?
Prior to 2013, the year PEPRA took effect, cities generally underfunded their pension obligations by 20-30%. According to Dan Lindheim, the City Administrator from 2008 to 2012, “pension plans were only about 70-80% funded then. People would say ‘80% is good enough.’" Moreover, he noted there was a prevailing belief that cities were safe if they stayed in the middle of the “pack”; if a pension crisis hit one city, it would hit all the cities the same way, at which point the State of California would be forced to provide a general bail-out.
As evidenced by the PEPRA reforms (described below), this is not what happened. The state instead called cities to account for their debts.
But underfunding wasn’t the only issue. City leaders often opted for “gold plated” plans offered by CalPERS. A former senior city leader (who asked to remain anonymous) noted that this was a convenient way to keep present budgetary costs down, while satisfying compensation demands of labor unions—i.e., a reduction in present-day wages was negotiated by offering richer pension plans.
Lindheim independently confirmed this view, noting: “In early 2000s, Boards and Councils—rather than giving full cost of living increases—they gave higher pension benefits. Oakland went from 2 to 2.7% benefit accrual per year for miscellaneous employees, and from 2.7 to 3.0% for public safety employees, without clear understanding of the budgetary implications. Hearsay is that leaders didn't care because people weren't screaming about UALs then. It wasn't until the Great Recession that UALs became a thing.”
Plans were very generous at that time, with safety employees granted full retirement benefits at the age of 50, and miscellaneous employees at age 55. These benefits are paid out for the rest of a retiree’s life, and continue to pay at 50% for the rest of a spouse's life that outlives the employee.
The problem was compounded by other issues:
Cities had the freedom to withhold reporting of unfunded pension liabilities in their annual consolidated financial statements and mandated state filings.
CalPERS maintained high expected returns on investment (a high discount rate) for the pension assets held in trust. This made UALs appear smaller than they were.
A pension holiday was granted in the 90s and early 2000s wherein CalPERS permitted cities not to contribute at all to pension plans. CalPERS felt market returns were so unexpectedly rich that they would cover the contribution costs. (This did not turn out to be true in the long-run.)
City pension formulas included bad-faith gimmicks that would elevate benefit payouts. For example, in some plans employer pension contributions were counted as “pay” used for calculation of the employee pension benefits. Thus saving for pension costs actually increased pension costs.
But these problems were impacting all California cities. So why is Oakland worse off?
As noted by the anonymous former city leader, Oakland made all the worst choices among its options. It granted the greatest benefits to employees while taking every option to reduce its pension contribution payments. The result was a massive unfunded actuarial liability, but that future consequence was out of sight and out of mind for leaders who would be long-since retired with their healthy pensions when it was time to pay-up.
And then came PEPRA
In 2013, all of this changed. PEPRA (Public Employees Pension Reform Act) normalized pension plans across the state, restricted cities’ freedoms to alter those plans, increased reporting requirements and transparency, required cities to fully fund present pension benefits, and forced cities to pay off remaining CalPERS UALs on a 25 year amortization schedule.
The net long term effect was to make pensions more sustainable and reduce the severe future consequences of underfunding liabilities. It is worth noting that more than half of pension benefits are paid with investment returns. Thus, every dollar of underfunding of a pension trust must be made-up by the city with two dollars of spending at the time benefits are paid out. Forcing the cities to fully fund pensions will save them a lot of money in the future.
But PEPRA’s forced-reckoning with past mismanagement is costly to cities in the short term. Cities have had to add millions of dollars in pension contributions and debt payments.
To ease this blow, CalPERS phased in the debt payments over a 5 year period, allowing cities to pay only 20% of amortized UAL costs in the first year, 40% in the next, and so on until they reached 100%. This resulted in less shock to cities, but the total liability continued to grow in the meantime because those payments were less than the interest rate CalPERS charges on that debt (currently 7%).
In addition, market gains and losses and assets are also amortized with the same type of schedule, resulting in potential increases in annual UAL costs with the same ramp-up of costs before they taper off in the long term.
The net effect of all these financing mechanisms is that UAL payments have been steadily escalating over the past several years, and will continue to grow until the peak at over $200M for Oakland between 2028 and 2032 (according to the most recent valuation reports for miscellaneous and safety employee plans).
What is the outlook for Oakland’s compensation costs?
Wages
To date, wages have been an equal contributor to compensation spending growth as has been the pension UAL growth. And the costs of those wage increases propagate proportionally to increased pension liabilities, creating a multiplier effect on the wage costs.
Pay raises have increased at nearly double the rate of inflation over the past decade, with major negative consequences for city service delivery. In the presently declining city revenue environment, it has meant significant reductions in staffing in the past two years, with the brunt of cuts applied to police and fire staff.
Union labor agreements are up for negotiation in 2025. And obviously to residents, this rate of wage growth is unsustainable. But the current administration and much of the City Council is strongly backed by labor interests. The Council President, Nikki Bas, even tagged herself the “Labor Candidate.” If those leaders remain in their seats in 2025, it is unclear whether the city will act to tame the spiraling wage growth, despite the negative consequences for residents.
PFRS
This is a spot of good news. As noted above, the pain associated with PFRS liabilities will be extinguished in 2026. The net effect of this close out of liabilities may be a $90M reduction in operating expenses for the city.
CalPERS normal costs
The CalPERS outlook is mixed. On one hand, normal costs appear to have been controlled to a sustainable level, thanks to PEPRA. The city's contributions are 11.5% for miscellaneous employees and 18.5% for safety, which averages to 14.8% across all employees. While significant, this is not wildly out of line with the 6.2% private employers contribute to social security (which pensioned public employees do not receive) plus the 3-4% 401K-matching that private companies typically pay employees.
These costs are now under control because PEPRA shifted the retirement age from 50 to 57 for police and 55 to 62 for miscellaneous employees (the “Tier 3” plan). It also slowed the accumulation of full pension benefits by about 25%, meaning that employees have to serve 25% longer to receive the same benefits as before PEPRA. These changes took effect for new employees in 2012 and 2013, and now 62% of active employees with retirement benefits are on the Tier 3 plan. As that number grows to 100% of employees, it will further reduce the normal cost rates paid by the city.
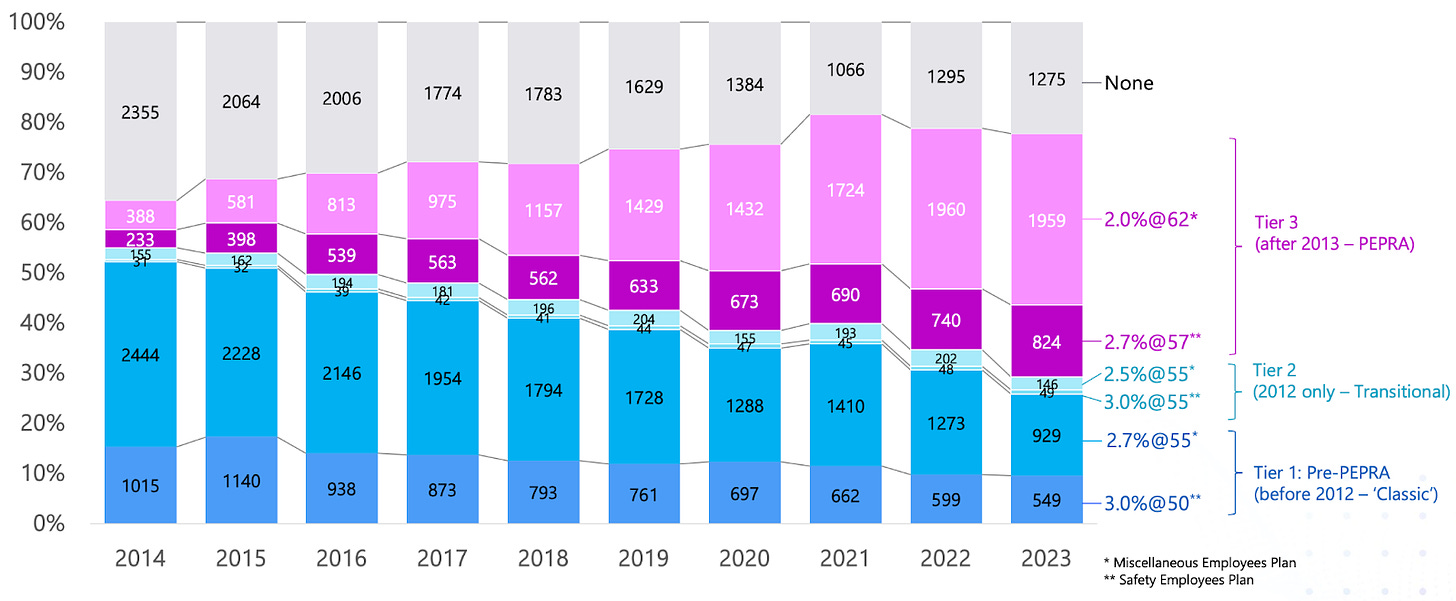
As noted previously, while the normal pension rate has been placed on a sustainable path, the total normal costs for pensions have still been escalating. This is driven by wage growth, not extended pension benefits. Regardless of pension formulas, control of pay raises will be necessary to control normal cost escalation.
CalPERS UAL costs
CalPERS UAL payments are going to burden the city for the next 20 years according to the most recent actuarial valuations (July 2022) for the public safety and miscellaneous employee plans, these costs are projected to vary from $150M to more than $200M for the next 20 years. By the end of that period, the city will have paid $1.5B in interest on the amortized UAL, in addition to the present principal balance of $1.9B.
These projections rely on the future unfolding according to CalPERS actuarial assumptions regarding mortality, retirement age, and market returns. Deviations in these assumptions could result in positive or negative swings in amounts owed for the UAL.
OPEB
Although OPEB holds a smaller liability of $500M compared to CalPERS plans, that liability continues to grow because the city is not fulfilling Resolution 87551, which requires a reduction in benefits if the contribution payments do not meet the minimum actuarial payment liability (and they are not). If this underfunding is not corrected, the OPEB liability could quickly scale to a level approaching that of the CalPERS UAL, leaving the city with unmanageable debt loads.
How is Oakland paying for all this pension debt?
The city uses three mechanisms to pay its debt payments: taxable bonds, adding costs to employee benefits, and direct payments from the General Fund.
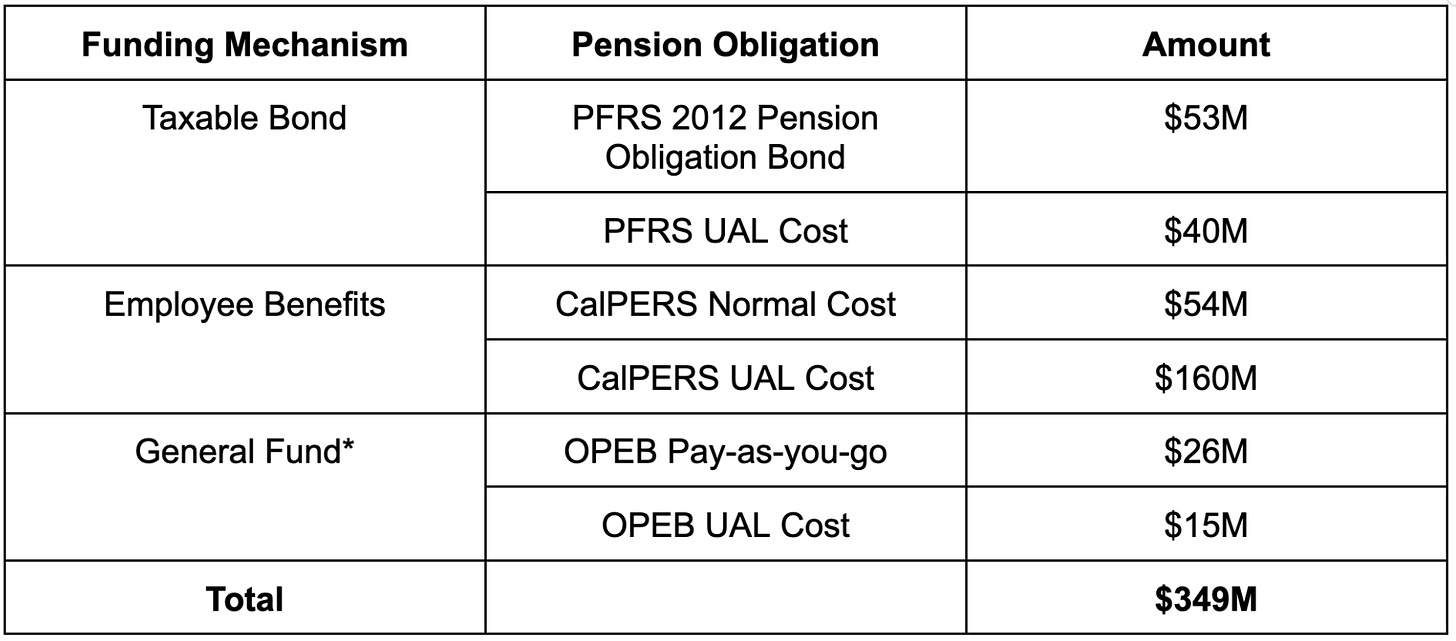
Taxable bonds were used to pay part of the PFRS UAL. A taxable bond is when the city borrows money from outside parties (via the bond market) like any other municipal bond, and backs the bond by levying a special tax on residents (e.g., the 2012 Pension Override Tax in the case of PFRS). The tax is used to pay the annual amortization payment.
The proceeds from the bond issuance are placed into the pension trust and used to pay benefit obligations to retirees. That trust money is also invested in the financial markets to earn a return. Typically pension asset managers can earn a higher return than the interest on the municipal bond—this is a form of arbitrage. The investment earnings increase the value of the pension trust assets and therefore lower the UAL more than would have if the equivalent bond payments were made directly to the pension trust.
The city took out its first taxable pension bond in 1997 (the “Pension Obligation Bond”) to pay down the PFRS UAL, and has repeatedly refinanced that bond. The final payment is due in 2026.
In 2023, the Pension Obligation Bond payment was $53M. However, the bond never covered the full value of the PFRS UAL, thus the city has also been making supplemental payments of about $40M to fully fund the UAL by 2026—a target date written into the City Charter in 1976 and as amended in 1988.
The Pension Override Tax of 2012 fully covers both the bond payment and the supplemental PFRS contributions.
The General Fund appears to be used to pay both the OPEB pay-as-you-go costs and the 2.5% contribution toward the UAL costs. However, neither the Annual Consolidated Financial Statements, nor the city budget are clear about the source of the funds for OPEB. We were also unable to find reports in the City Council proceedings or City website that indicate the source of funds. Thus, we cannot be certain how these OPEB obligations are paid.
It is possible that they are paid as additional employee benefits, but when we rectified the city employee pension benefit payments reported to the state controller against the required normal and UAL cost contributions required for all city pension obligations, the totals do not match. The reported pension payments only account for the obligations to CalPERS, but not OPEB. This suggests that OPEB contributions likely come from General Fund sources—though it is unclear which sources.
Adding costs to employee benefits is the third mechanism used to pay the pension obligations. In this case, the city treats the UAL costs as a standard employee benefit, and spreads those costs across the current city employees as a percentage of their base wages. This benefit is paid by the city, not the employee. So while it does not impact employee income, it does raise the city’s cost of employees significantly. Payments for UAL costs are nearly 3 times higher than payments for pension normal costs.
The problems with how Oakland pays its pension debt
Oakland pays its $164M of CalPERS UAL costs by treating them as employee benefits and layering those costs as additional payroll costs. While this does not negatively affect employee compensation, it has negative consequences for the city and residents.
First, it distorts the apparent compensation paid to employees because the UAL payments would seem to be accruing to present employees, but they are in fact debt payments to former employees. This leads to distrust between employees and the taxpayers who pay their compensation. It also leads to misunderstanding of the true cost of compensation which could negatively impact rational decision-making in wage negotiations with labor unions.
Second, it raises the actual per-employee cost to the city for each and every staff position. This literally means that public tax dollars pay for fewer staff in Oakland. I.e., when residents approve of a new tax measure to fund city services like parks, they get less employees and less services for that money than they should, because a large portion of those funds are going toward debt payments on UALs unbeknownst to the taxpayers.
Third, it hides the true costs of UAL debt from the public, treating it like a contractual cost of labor. But debt is not a labor cost, it’s a financing cost. As such, there are financial tools to better manage it and reduce its impact on operating budgets. By stuffing the debt into a compensation line item, it prevents residents and city leaders from recognizing the scale and nature of the debt. It prevents public participation in political accountability and constructive actions to find solutions to the debt problem.
For example, compare the annual PFRS summary reports received by the City Council (PFRS is treated as a liability) with the CalPERS UALs. CalPERS receives no such summary reports because they are treated as employee compensation costs. PFRS obligations are transparently managed with a financing mechanism that mitigates the financial burden on taxpayers. This is not the case for the CalPERS UAL.
Three different former city employees indicated that the practice of treating UAL debt as compensation was started in 2013 under City Administrator Sabrina Landreth. We attempted to verify this, but Ms. Landreth did not respond to multiple requests for comment. Nonetheless, analysis of pension data obtained from the GCC and CalPERS suggest this is what the city is doing. The practice is not standard across cities. Besides Oakland, only Long Beach, Stockton and Fresno currently employ this practice. (See slide 17 in supplement.)
The rationale for this practice was explained by the aforementioned anonymous city leader. It allows the city to distribute the cost of debt across both restricted and unrestricted funds. If treated explicitly as debt payments, the entire UAL cost would have to be borne by the city's unrestricted General Purpose Fund. That fund pays nearly all of police and fire expenses, and a smaller fraction of other department expenses. Thus, paying for the UAL solely with unrestricted funds would have catastrophic consequences for the city’s public safety budget, likely forcing the layoff of several hundred police and fire officers from an already depleted department. By distributing the costs across both restricted and unrestricted funds as compensation cost, the city is able to mitigate the impact on safety services that are paid mostly with restricted funds.
For PFRS, the city directly pays its $94M of obligations from the special Pension Override Tax. This causes no specific issues for the city presently.
For OPEB, the city appears to pay its $41M of obligations from General Funds. The city does not report what specific sources are used to pay for OPEB costs. It is likely that these are tucked away within the Health Benefits line items of employee compensation. If so, it would have exactly the same negative implications for employees and taxpayers as does the treatment of CalPERS UALs as current employee compensation.
The insidious costs of underfunding pensions
Regardless of how the city is now paying for unfunded pension liabilities, the consequences are grave. Payments for UALs totaled $280M in 2023 (see slide 7 of supplement), consuming 28% of the city’s present $1.04B of unrestricted revenues from taxes, grants and fees. This is much larger than the city's structural deficit of $100M, and is also equal to 75% of the entire police department budget. To put that cost into perspective, that amount of money is enough to fund more than 900 sworn police officers.
Yet the cost of failing to save for pension liabilities is even worse than it seems. In a fully-funded pension plan, approximately half of benefits are paid from investment returns, the other half comes from direct employee and employer contributions. By not saving for retirement, the city is forced to make-up for those lost returns with direct payments of taxpayer dollars. These costs are paid via a 7% annual interest charged on the unfunded liability. For CalPERS alone, that means the city is paying $133M / year interest to cover the lost return on assets, 81% of the city’s $164M UAL payment just for interest payments. Over the course of the 25 year amortization period, this totals $1.5B in interest payments—money that would otherwise stay in taxpayer pockets or go to improved city infrastructure and services.
The difficult path to sustainability
Pension systems are a case study in risk management. In a “defined contribution” retirement plan (like a 401K) which is typical of private companies, employees and employers contribute money to a savings account that earns returns in the financial market. When an employee retires, the employee gets whatever they have saved plus market returns. The employee alone carries the risk of saving too little to afford retirement.
But in pension systems (“defined benefit” plans), the employer carries 100% of the risk. The employee gets a fixed payment, which is typically increased annually with a cost of living adjustment (2% per year for Oakland retirees) no matter how much is saved to pay for it. The amount saved by the employee and employer to pay for these benefits is solely determined by the employer. And the risk of under saving is also carried solely by the employer.
The trouble with this arrangement is that people are generally very bad at managing future risk, particularly when those risks are not borne by them personally and they have no liability for the consequences of poor decisions on those risks. This was the case for elected leaders in Oakland prior to 2013.
Until PEPRA in 2013, elected leaders were completely isolated from the financial consequences of future retirement benefits they promised. But since PEPRA now requires full funding of those promises, this is no longer the case. If elected leaders increase benefits, they will immediately feel the impact on their budgets.
As a result, the City of Oakland has been more proactively grappling with its pension problems since 2013. While this is good for the future health of the city, it is a problem today because the city, and the taxpayers who fund the city, are paying both for present benefit commitments and the accumulated financial irresponsibility of the past 40 years of mismanaged pensions.
So what can the city do about that burden now?
Potential salvation
As noted above, the city is paying 7% interest ($133M) on the CalPERS UAL. Effectively, this interest payment compensates for the investment returns that CalPERS would otherwise earn on the assets owed by the city. Since CalPERS doesn’t have those assets, it cannot invest them in the market.
But that interest rate is far higher than the interest rate Oakland might pay on an equal amount of municipal debt. As of September 7, 2024, 30-year municipal bonds are yielding 3.56%. If the city obtained a $1.9B municipal bond at this yield, and used the proceeds to pay off the CalPERS UAL, it would lower the city’s UAL costs from about $160M to $104M, and lower the current interest portion of that from $133M to $67M. This $56M of savings would have a dramatic impact on the city’s ability to deliver services. For example, it would pay for about 190 additional sworn police officers.
Beyond refinancing CalPERS UAL debt, there also exists a prospective $347M surplus in the Pension Override Tax fund balance. This money could potentially be used to pay down the CalPERS UAL, saving the city an additional $20M per year in debt payments.
But thoughtful refinancing of debt is not the only action the city needs to regain financial stability and restore effective services and infrastructure. No matter how well the city manages its UALs, it has no impact on wages of present employees. The city must get its wage escalation under control.
Presently, wages are set in closed-door negotiations between the city administration, the City Council, and union leaders that helped elect the very city leaders who are negotiating with them. The public has no ability to know what is said, or how deals are cut. Clearly this is a conflict of interest that undermines city leaders' commitment to the interests of residents they are elected to serve. These negotiations need to be made more transparent.
Regardless of that conflict, or improved transparency rules, city leaders need to double-down on their commitment to serve city residents who need them first and foremost.
METHODOLOGY
Supplemental data
Additional information and figures are available in a supplemental side report.
Aggregated and cleaned data are available in these spreadsheets:
Key data sources
General California Compensation (GCC) database. This database is maintained by the state controller’s office. Cities are required to report their compensation data by positions held by all employees and their departments, but not employee names. This data breaks down compensation into the components reported here: base pay (reported as “regular” pay), other pay, lump sum pay, overtime pay, health-vision-dental benefits, defined benefit pension contributions, and other categories. It does not break-down pension costs into normal and UAL costs
CalPERS Public Agency Required Contributions. This data is updated and posted annually by CalPERS for over 4000 agencies maintaining pension plans with CalPERS. Since 2016 it breaks-down pension contributions into normal and UAL costs.
Transparent California database. This database is a cleaned and augmented version of the GCC data. Transparent California obtains the GCC data, and the employee names receiving the compensation, via public records request. It then aggregates data by employee. GCC data may contain multiple records per year per employee because those employees change positions. Thus Transparent California’s data provides a more accurate count of actual city employees. Transparent California also labels employees as full time or part time by comparing base wages to the allowable compensation range for each employee’s position. If the base wages are less than the range, they are assumed to be working part time.
Bureau of Labor Statistics. Provides regionally adjusted inflation data.
Notes on sources and data cleaning
From 2013 to 2017, UAL payment costs were not broken out by CalPERS. UAL costs were included in the Normal Rate value. Therefore, we inferred normal and UAL costs from 2013 to 2017 by calculating normal costs using the lowest normal rate reported after 2017, and then subtracting these costs from the total reported pension costs. The remainder is the UAL cost.
From 2013 to 2015, only miscellaneous employee pension plan costs were provided by CalPERS, no safety plan data was provided. For some analyses in this article, we inferred CalPERS pension costs for these years using the total pension costs reported in the GCC data, and assuming the split between normal and UAL costs was identical to the split in 2016.
Pension amounts reported to GCC by cities do not exactly match the contribution amounts issued by CalPERS, but they are generally close. Possible explanations for this discrepancy:
CalPERS reports FY July to June, while cities may report calendar year data to the state controller. The reporting period is not explicitly stated on the GCC website.
Cities may pay more into the plan. Presumably they can also pay less, but it is not clear if penalties are incurred for doing so.
Cities may report other pension costs in the GCC data besides CalPERS required contributions
Cities may spread the payments across various employees and departments in differing ways. E.g., Oakland probably applies the UAL proportionally to individual total compensation (including OT) which distorts the UAL cost load onto public safety, even though the CalPERS costs are proportionately more for miscellaneous employees.
Some cities include UAL payments in their GCC reporting, some do not. Reporting may also vary across years for a single city. In theory cities flag whether they do or do not include them. However this flag data is often incorrect, as can be seen from the analysis in slide 17 of the supplementary information.
Yellow cells and tabs in the supporting data indicate incomparable data due to some cities including UAL payments in compensation, and some not.
CalPERS manages the pension plans for the City of Oakland and over 4000 other public agencies in California. It has been managing Oakland’s pensions since at least 1976. Employees generally receive up to 100% of their highest three-years salary for the rest of their life after retirement, their spouse receives 50% if they outlive the employee.
The GCC database incorrectly reports the number of city employees. The correct number of employees in 2023 was 5100 full and part time employees as reported by Transparent CA based on public records request information, which were filling 4612 budgeted positions. The error in GCC data is because they count total wage records submitted by cities, but cities typically submit multiple records for employees, one for each position they hold in that year. Thus some employees are multiply-counted in the GCC data.
GCC data does not provide accurate employee counts, nor full and part time status of employees. For this we used Transparent California data which provides both. However, Transparent CA must estimate the full and part time status by comparing actual annual base compensation to the allowable range. Anyone receiving less than the range is considered part time. This is reasonable, but still an estimate of true counts of full and part time employees.
It is possible that the City of Oakland is including some of the OPEB liability costs as Health Benefits within the employee compensation amounts. But as of the date of publication, we were unable to obtain evidence for or against this possibility, and therefore assume it is not included.


PEPRA also caps the annual salary used in the average of the final 3 years of compensation at far less than PERS classic. So higher paid workers don’t benefit from wages earned above that cap. Excellent reporting thank you!
This piece is beyond excellent. Thank you.