

Election results follow long-established voting patterns in Oakland
East Oakland had a disproportionately low influence due very low voter turnout, but slightly favored Lee. West Oakland/Temescal and district 4 dominated voter turnout, but favored opposing candidates.

A spate of articles and social media memes last week promoted the long-standing notion that Oakland is divided between the “hills” and the “flats.” This meme was amplified by a two-color map of Oakland’s April 15 special election results published by the Alameda County Registrar of Voters.1 It appeared to show an all-or-none split between mayoral candidates Barbara Lee and Loren Taylor along hard geographic boundaries.
Barbara Lee’s victory, with 53% of the vote, was a close one. And her victory was largely secured by high-turnout progressive voters in West Oakland and part of North Oakland (Temescal) who strongly favored her by about a 20% margin. Conversely, “hills” of Oakland favored Taylor by a similar margin, while the rest of the city was more neutral, favoring Lee by a few percentage points.2 (See maps and charts below.)
But the truth, as always, is more nuanced. The mayoral election followed well-established voting patterns across the last nine years and 230 election contests. These patterns were identified before the election by the San Francisco Chronicle through rigorous data analysis of the last nine years and 230 election contests.
Consistent with those patterns, voter turnout in East Oakland was poor—even more so than usual. Only 10% of the population of East Oakland district 7 voted. Whereas 38% of the hills district 4 population (the highest turnout district) and 31% of the Temescal/North Oakland population showed up at the polls—also historically consistent.
East Oakland tends to be a more conservative electoral block, and it might have the power to reshape Oakland politics as we know it, if it turned out in force at the polls.
The election also included contests for district 2 council member, and a half-cent sales tax increase (Measure A).
The district 2 race was a landslide victory for Charlene Wang, who won 59% of the vote over her nearest opponent. And Wang lost only two of the 14 precincts in the district. Even then, she only lost those only by a thin margin.
True to form, Oaklanders also passed the Measure A sales tax increase easily. It won in every precinct—even the most “conservative” of them. Surprisingly, since it is a regressive tax, it did even better in the low-income and middle class communities than it did in the higher-income communities.
Maps of the election
We present below the results each contest painted across the precinct maps. The color intensity signifies the margin by which each precinct favors a candidate.3
We also provide a novel view of the precinct data by scaling the size of the precinct according to its voter turnout. This illustrates not just the favored choice of the precinct, but also its relative contribution to the overall election outcome. It underscores that East Oakland has a disproportionately low influence on Oakland governance due to its low voter turnout.
Note, the % values shown on the maps are the portion of vote won by the candidate named in the title. They are not voter turn-out. The size of the precinct shapes in the scaled maps shows the turnout: a precinct shape that is twice as large as another precinct means it contributed twice as many votes to the total votes across the city.
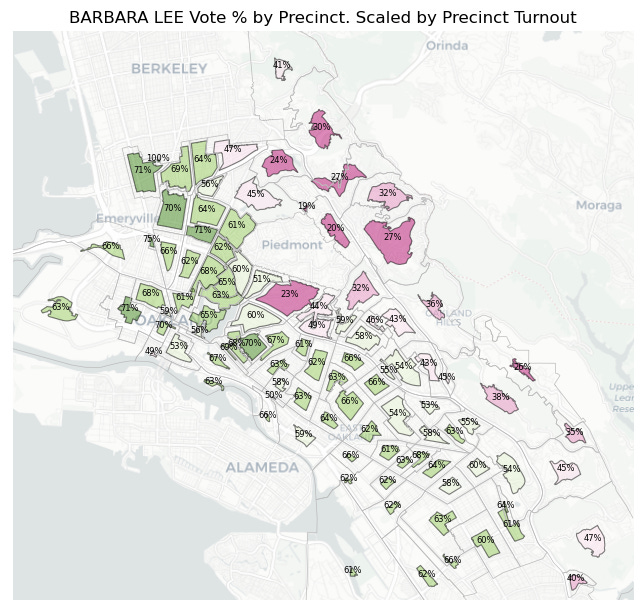
Mayoral election contest
Precincts favoring Barbara Lee in green hues, precincts favoring Taylor in pink hues. Darker means more favorable toward the dominant candidate. Percentages reflect the vote share won by Barbara Lee.


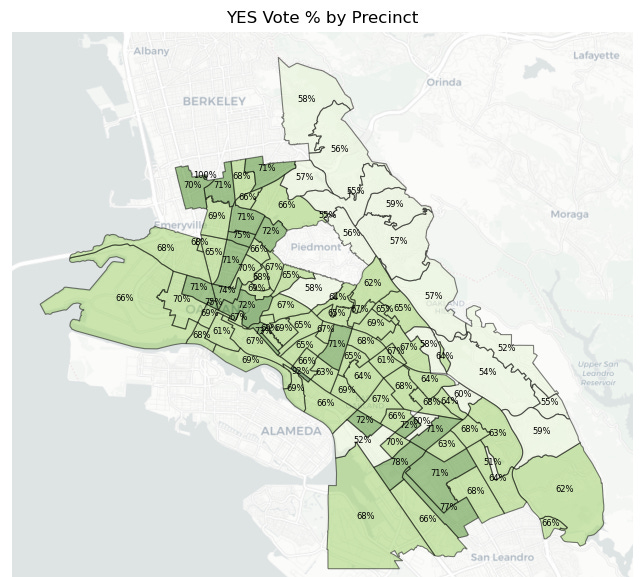
Measure A (half-cent sales tax increase)
Precincts favoring YES, INCREASE THE TAX in green hues. Darker means more favorable toward the dominant candidate. Percentages reflect the vote share won by YES votes. There was not a single precinct that favored NO.

District 2 council member contest
Precincts favoring Charlene Wang in green hues, precincts favoring Kara Murray-Badal in pink hues. Darker means more favorable toward the dominant candidate. Percentages reflect the vote share won by Charlene Wang.


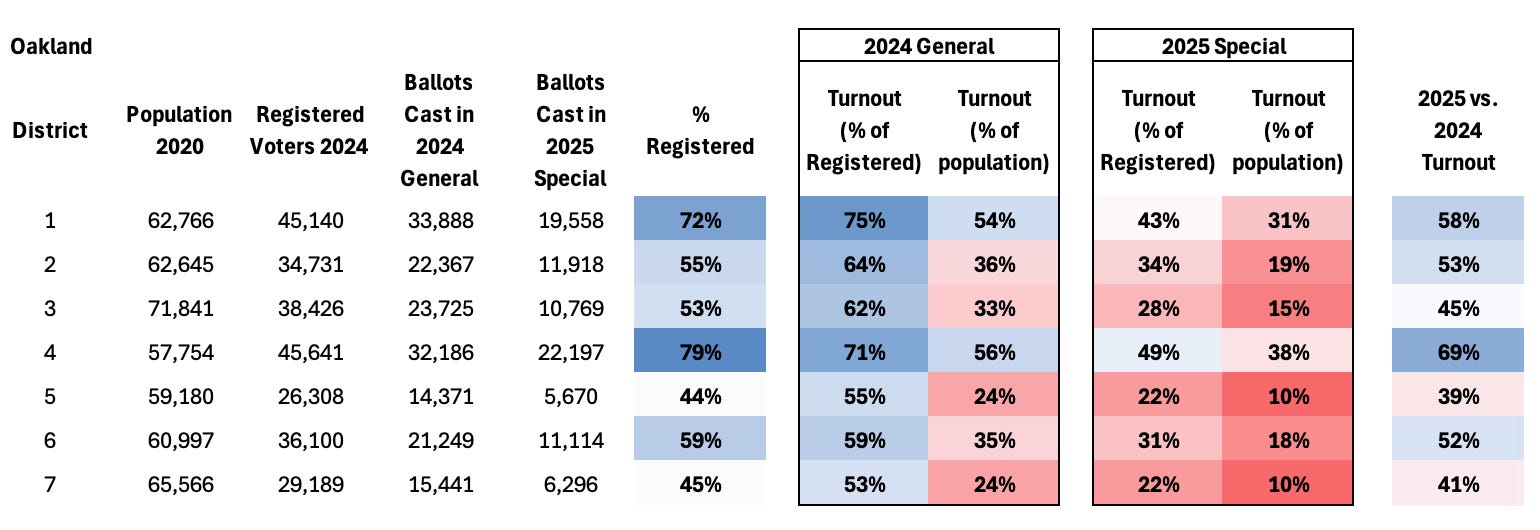
Voter turnout
Voter turnout dropped by half or more across districts for this April 2025 special election compared to the November 2024 general election. Districts 1 and 4 consistently have the highest turnout, while districts 5 and 7 have the lowest.

Tags: Elections, Mayor, City Council
Voter map produced by Alameda County Registrar of Voters. Captured on April 20, 2025. Precincts are colored according to whether they voted 50% or more for one candidate or the other.

The voting behavior of Oakland residents appears to be significantly correlated with their status as renter or home owner.
Data were obtained from the Alameda County Registrar of Voters Cast Voter Records posted on April 18, 2025 at 5pm.
Sadly, the public employees unions own Oakland politics. They are by far the largest contributors to political campaigns. And the so-called independent expenditure political funds provide dishonest last minute hit pieces. Statewide reform is needed to disrupt the pipeline from mandatory union dues to political action spending.
Absurd. Taylor won, as he did previously. But got *cancelled*, in order that the quagmire of corruption, corporate greed, ethnic cleansing, minimalization of law enforcement, backhanders, and the pimpimg out of Oakland to greed, construction contracts, and hideous construction projects can avoid being held in check and be held accountable.
We will NEVER be Manhattan. This entire council needs to be replaced, with the exception of possibly 2 members.